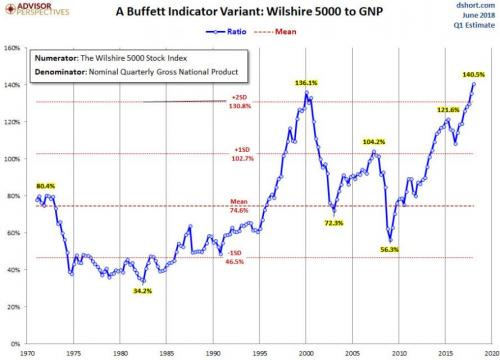
Warren Buffet's Top Market Indicator Signals Crash Due Soon
At Zerohedge.com a recent article:
Buffett's Favorite Indicator Exposes A Stock Market More Primed For A Crash Than Ever Before
suggests that: "Warren Buffett’s favorite indicator is telling us that stocks are more overvalued right now than they have ever been before in American history."
Zerohedge started with excerpts from this article at TheEconomicCollapseblog.com
"Warren Buffett’s favorite indicator is telling us that stocks are more overvalued right now than they have ever been before in American history. That doesn’t mean that a stock market crash is imminent.... what it does tell us is that stock valuations are more bloated than we have ever seen and that a stock market crash would make perfect sense. So precisely what is the “Buffett Indicator”? Well, it is actually very simple to calculate. You just take the total market value of all stocks and divide it by the gross domestic product. When that ratio is more than 100 percent, stocks are generally considered to be overvalued, and when that ratio is under 100 percent stocks are generally considered to be undervalued. The following comes from MSN…
That being said, the Buffett Indicator, while it’s not a flawless indicator, does tend to peak during hot stock markets and bottom during weak markets. And as a general rule, if the indicator falls below 80%-90% or so, it has historically signaled that stocks are cheap. On the other hand, levels significantly higher than 100% can indicate stocks are expensive.
For context, the Buffett indicator peaked at about 145% right before the dot-com bubble burst and reached nearly 110% before the financial crisis. So where are we today?

Right now we are at almost 149 percent, which is the highest level ever recorded…
Where does the Buffett Indicator stand now? It may surprise you to learn that, at nearly 149%, the total market cap to GDP ratio has never been higher. It’s even higher than the 145% peak we saw during the dot-com bubble.
The Buffett Indicator is very simple, but it is also very accurate. If you want to do well in the stock market, you want to buy low and sell high, and right now we are in absurdly high territory. Stock valuations always return to their long-term averages eventually, and many believe that the coming stock market crash is going to arrive sooner rather than later."
For a different chart with a similar warning message:

Based on such charts, a stock market collapse of at least 30-40% seems likely soon. Imagine the lack of confidence, the lack of lending (remember late 2008?) and the economic slowdown that would follow a market meltdown that sees 8-10 THOUSAND points shaved off the DJIA...
I have long argued that the world has spent its future, that the piper will eventually need to be paid, that economic collapse will precede WWIII... now here we are preparing for domestic wartime production by putting tariffs on foreign goods.... My prophetic timeline may still play out on schedule as detailed in my books on end times prophecies...

